Query Optimization 01 – What is my accepted answer percentage rate [StackOverflow]
I am very often asked on how to start query tuning which gave me an idea to start a Query Tuning blog series. I shall be taking random and slow performing queries from data.stackexchange.com.
This is my first blog post from series Query Optimization. Today we will try to optimize What is my accepted answer percentage rate.
Details about my SQL Server environment is as below:-
| Version: | SQL Server 2014 Developer Edition 12.0.5000 (x64) |
| Processor: | Intel(R) Core(TM) i5-6300U CPU @ 2.40GHz |
| OS: | Windows 7 Enterprise Service Pack 1 |
| OS Memory: | 8.00 GB |
| Hard Disk: | 250 GB SSD |
I have configured 4096 MB for SQL Server Max Memory with 4 TempDB data files each with 200 MB intial file size and 100 MB file growth.
So below is the query that we need to optimize.
|
1 2 3 4 5 6 7 8 9 10 11 12 13 14 15 16 17 18 19 20 |
-- On avg how often are answers I give, accepted SET NOCOUNT ON; SET STATISTICS IO ON; SET STATISTICS TIME ON; DECLARE @UserId int = 9 -- Answer = 42.8571428571429 SELECT (CAST(Count(a.Id) AS float) / (SELECT Count(*) FROM Posts WHERE OwnerUserId = @UserId AND PostTypeId = 2) * 100) AS AcceptedPercentage FROM Posts q INNER JOIN Posts a ON q.AcceptedAnswerId = a.Id WHERE a.OwnerUserId = @UserId AND a.PostTypeId = 2 GO |
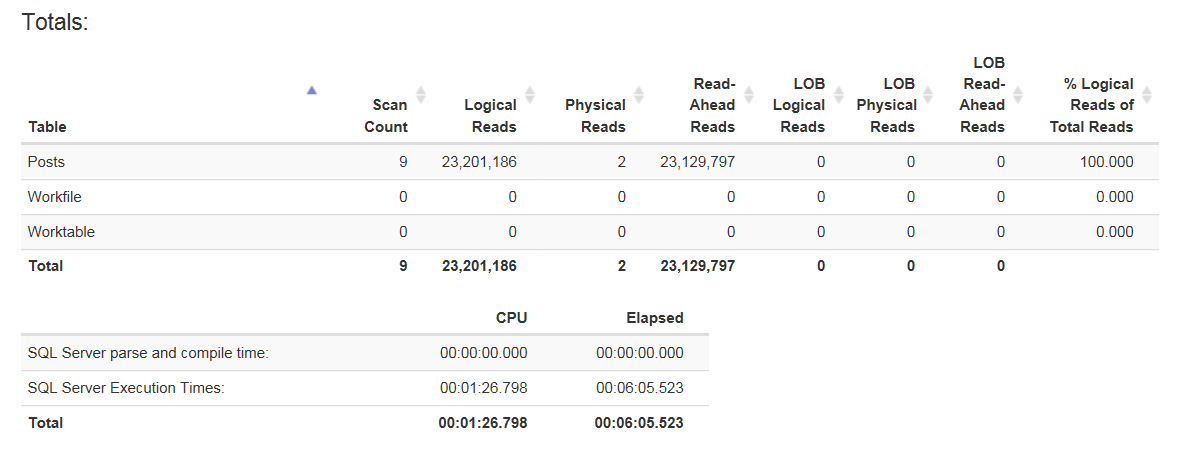
I personally prefer to analyze Logical Reads as key performance parameter for Query Tuning. Below is the screenshot of statistics for above query from statisticsparser.com:-
 Also, Below is the execution plan:-
 Digging further on top right most Clustered Index Scan Operator, and checking the value for Number of Rows Read & Actual Number of Rows, we can see that SQL Server is suggesting of Residual IO operation.
 In order to rectify the problem, we may need to remove this Residual IO operation with Index Seek operator by considering residual predicate.
So lets first modify it to make it easier to read and analyze.
|
1 2 3 4 5 6 7 8 9 10 11 12 13 14 15 16 17 18 19 20 |
SET STATISTICS IO ON; SET STATISTICS TIME ON; DECLARE @UserId int = 9 ;WITH T_Posts AS ( -- Get answers of @UserId SELECT p.Id FROM dbo.Posts p WHERE p.OwnerUserId = @UserId AND p.PostTypeId = 2 ) ,T_Posts_a AS ( --Filter answer of @UserId accepted by others SELECT COUNT(*) AS Accepted_Counts, (SELECT Count(*) FROM T_Posts) AS Total_Answer_Counts FROM T_Posts p WHERE p.Id IN (SELECT q.AcceptedAnswerId FROM Posts q) ) SELECT (CAST(Accepted_Counts AS float) / Total_Answer_Counts * 100) AS AcceptedPercentage FROM T_Posts_a GO |
Our table [dbo].[Posts] has only Primary Clustered Index on [Id] field. 4-5 indexes comprising 2-3 key columns should not be issue in most cases. So let’s create a non-clustered index on Predicate Fields of CTE [T_Posts].
|
1 2 3 4 5 6 |
-- Create Non-Clustered Index to remove Residual IO by Index Seek USE [StackOverflow] GO CREATE NONCLUSTERED INDEX NCI_OwnerUserId_PostTypeId_Includes ON [dbo].[Posts] ([OwnerUserId],[PostTypeId]) INCLUDE (Id) GO |
Below are the Execution Plan and stats screenshot after creating above Non-Clustered Index.


We can see that our key performance parameter Logical Reads has reduced to 7,734,109 from 23,201,186 thus executing within 2 minutes.
Now, to further optimize our query, we need to replace bottom half of Nested Loop in Execution Plan with another non-clustered Index to avoid Clustered Index scan for IN predicate logic of CTE
[T_Posts_a].
|
1 2 3 4 5 |
USE [StackOverflow] GO CREATE NONCLUSTERED INDEX NCI_AcceptedAnswerId ON [dbo].[Posts] ([AcceptedAnswerId]) GO |
After executing, the query again, we have below Execution Plan and Stats:-


Finally our query has executed 68 milliseconds performing only 153 Logical Reads to achieve the desired result.
Conclusion: A little modification of query along with analyzing the Execution Plan can help us to decide proper indexing and querying changes. Happy Coding
Friends, please feel free to correct me by comments. Share your approach if it differs from mine. If you like the article, do Like & Share.
Related Posts


![Result Set of [sp_WhoIsActive]](https://i0.wp.com/ajaydwivedi.com/wp-content/uploads/2016/12/Log_Activities-02-1.png?resize=60%2C57&ssl=1)
About The Author
Ajay Dwivedi
I am Microsoft Certified Professional having 10+ years of experience in SQL Server Querying, Database Design, and Administration. I am fond of Query Tuning and like to automate things using TSQL & PowerShell. I also have experience of implementing end-to-end Data Warehouse solution, and Data Migration using ETL tools SQL Server Integration Services (SSIS), Pentaho Business Analytics, and have designed Database Inventory through PowerShell, Python, and Django etc.
Good. It helped me.
Thanks Ajay